 MENU
MENU


NOTE!
Click on MENU to Browse between Subjects...17CS62 - COMPUTER GRAPHICS AND VISUALIZATION
6TH SEMESTER CSE
Answer Script for Module 1
Solved Previous Year Question Paper
CBCS SCHEME
COMPUTER GRAPHICS AND VISUALIZATION
[As per Choice Based Credit System (CBCS) scheme]
(Effective from the academic year 2017 - 2018)
SEMESTER - VI
Subject Code 17CS62
IA Marks 40
Number of Lecture Hours/Week 3
Exam Marks 60
These Questions are being framed for helping the students in the "FINAL Exams" Only
(Remember for Internals the Question Paper is set by your respective teachers).
Questions may be repeated, just to show students how VTU can frame Questions.
- ADMIN
17CS62 - COMPUTER GRAPHICS AND VISUALIZATION
6TH SEMESTER CSE
Answer Script for Module 1
Some of the applications of computer graphics are:
-
Computer Art:
Using computer graphics, we can create fine and commercial art which include animation packages, paint packages. These packages provide facilities for designing object shapes and specifying object motion. Cartoon drawing, paintings, logo design can also be done.
-
Computer Aided Drawing:
Designing of buildings, automobile, aircraft is done with the help of computer aided drawing, this helps in providing minute details to the drawing and producing more accurate and sharp drawings with better specifications.
-
Presentation Graphics:
For the preparation of reports or summarising the financial, statistical, mathematical, scientific, economic data for research reports, managerial reports, moreover creation of bar graphs, pie charts, time chart, can be done using the tools present in computer graphics.
-
Entertainment:
Computer graphics finds a major part of its utility in the movie industry and game industry. Used for creating motion pictures , music video, television shows, cartoon animation films. In the game industry where focus and interactivity are the key players, computer graphics helps in providing such features in the efficient way. -
Education:
Computer generated models are extremely useful for teaching huge number of concepts and fundamentals in an easy to understand and learn manner. Using computer graphics many educational models can be created through which more interest can be generated among the students regarding the subject. -
Training:
Specialised system for training like simulators can be used for training the candidates in a way that can be grasped in a short span of time with better understanding. Creation of training modules using computer graphics is simple and very useful. -
Visualisation:
Today the need of visualise things have increased drastically, the need of visualisation can be seen in many advance technologies , data visualisation helps in finding insights of the data , to check and study the behaviour of processes around us we need appropriate visualisation which can be achieved through proper usage of computer graphics -
Image Processing:
Various kinds of photographs or images require editing in order to be used in different places. Processing of existing images into refined ones for better interpretation is one of the many applications of computer graphics.
-
Machine Drawing:
Computer graphics is very frequently used for designing, modifying and creation of various parts of machine and the whole machine itself, the main reason behind using computer graphics for this purpose is the precision and clarity we get from such drawing is ultimate and extremely desired for the safe manufacturing of machine using these drawings.
-
Graphical User Interface:
The use of pictures, images, icons, pop-up menus, graphical objects helps in creating a user friendly environment where working is easy and pleasant, using computer graphics we can create such an atmosphere where everything can be automated and anyone can get the desired action performed in an easy fashion.
Figure 2.1 shows one way to organize the components of a raster system that
contains a separate display processor
, sometimes referred
to as a graphics controller
or a display coprocessor
.
The purpose of the display processor is to free the CPU from the graphics chores. In addition to the system memory, a separate display-processor memory area can be provided.
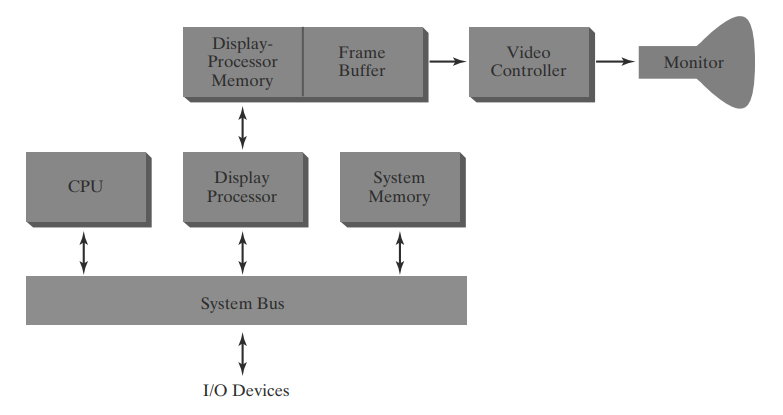
Fig 2.1 Architecture of a raster-graphics system with a display processor.
A major task of the display processor
is digitizing a
picture definition given in an application program into a set of pixel
values for storage in the frame buffer. This digitization process is called scan conversion
.
Graphics commands specifying straight lines and other geometric objects are
scan converted into a set of discrete points
,
corresponding to screen pixel positions
.
Scan converting a straight-line segment, for example, means that we have to
locate the pixel positions closest to the line path and store the color for
each position in the frame buffer
. Similar methods are
used for scan converting other objects in a picture definition.
Characters can be defined with rectangular pixel grids
, as
in Figure 2.2, or they can be defined with outline shapes, as in Figure
2.3. The array size for character grids can vary
from
about 5 by 7 to 9 by 12
or more for higher-quality
displays.
A character grid
is displayed by superimposing the
rectangular grid pattern into the frame buffer at a specified coordinate
position. For characters that are defined as outlines, the shapes are
scan-converted into the frame buffer by locating the pixel positions
closest to the outline.
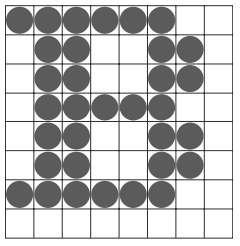
Fig 2.2 A character defined as a rectangular grid of pixel positions.
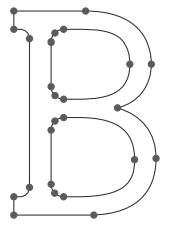
Fig 2.3 A character defined as an outline shape.
Display processors
are also designed to perform a number of additional operations. These
functions include generating various line styles
(dashed,
dotted, or solid), displaying color areas
, and applying transformations to the objects
in a scene. Also, display
processors are typically designed to interface with interactive input
devices, such as a mouse.
In an effort to reduce memory requirements in raster systems, methods have
been devised for organizingthe frame buffer as a linked list
and encoding the color information.
One organization scheme is to store each scan line as a set of number
pairs. The first number in each pair can be a reference to a color value,
and the second number can specify the number of adjacent pixels on the scan
line that are to be displayed in that color. This technique, called run-length encoding
, can result in a considerable saving
in storage space if a picture is to be constructed mostly with long runs of
a single color each.
A similar approach can be taken when pixel color change linearly. Another
approach is to encode the raster as a set of rectangular areas
(cell encoding
).
The disadvantages
of encoding runs are that color changes
are difficult to record and storage requirements increase
as the lengths of the runs decrease.
In addition, it is difficult for the display controller to process the
raster when many short runs are involved. Moreover, the size of the frame buffer
is no longer a major concern,
because of sharp declines in memory costs. Nevertheless, encoding methods
can be useful in the digital storage and transmission of picture
information.
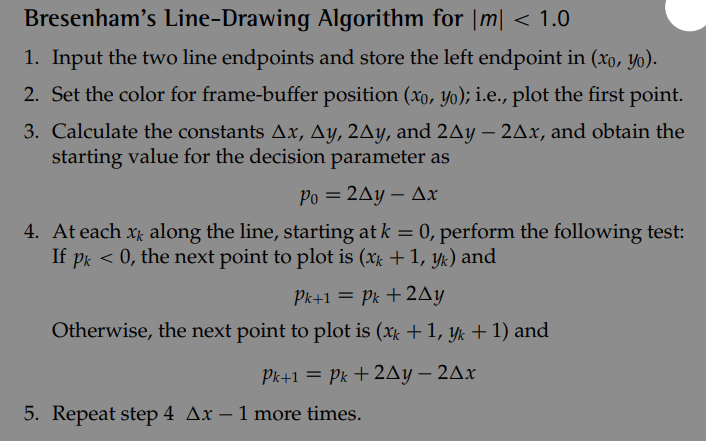
An accurate and efficient raster line-generating algorithm, developed by Bresenham
, that uses only incremental integer
calculations.
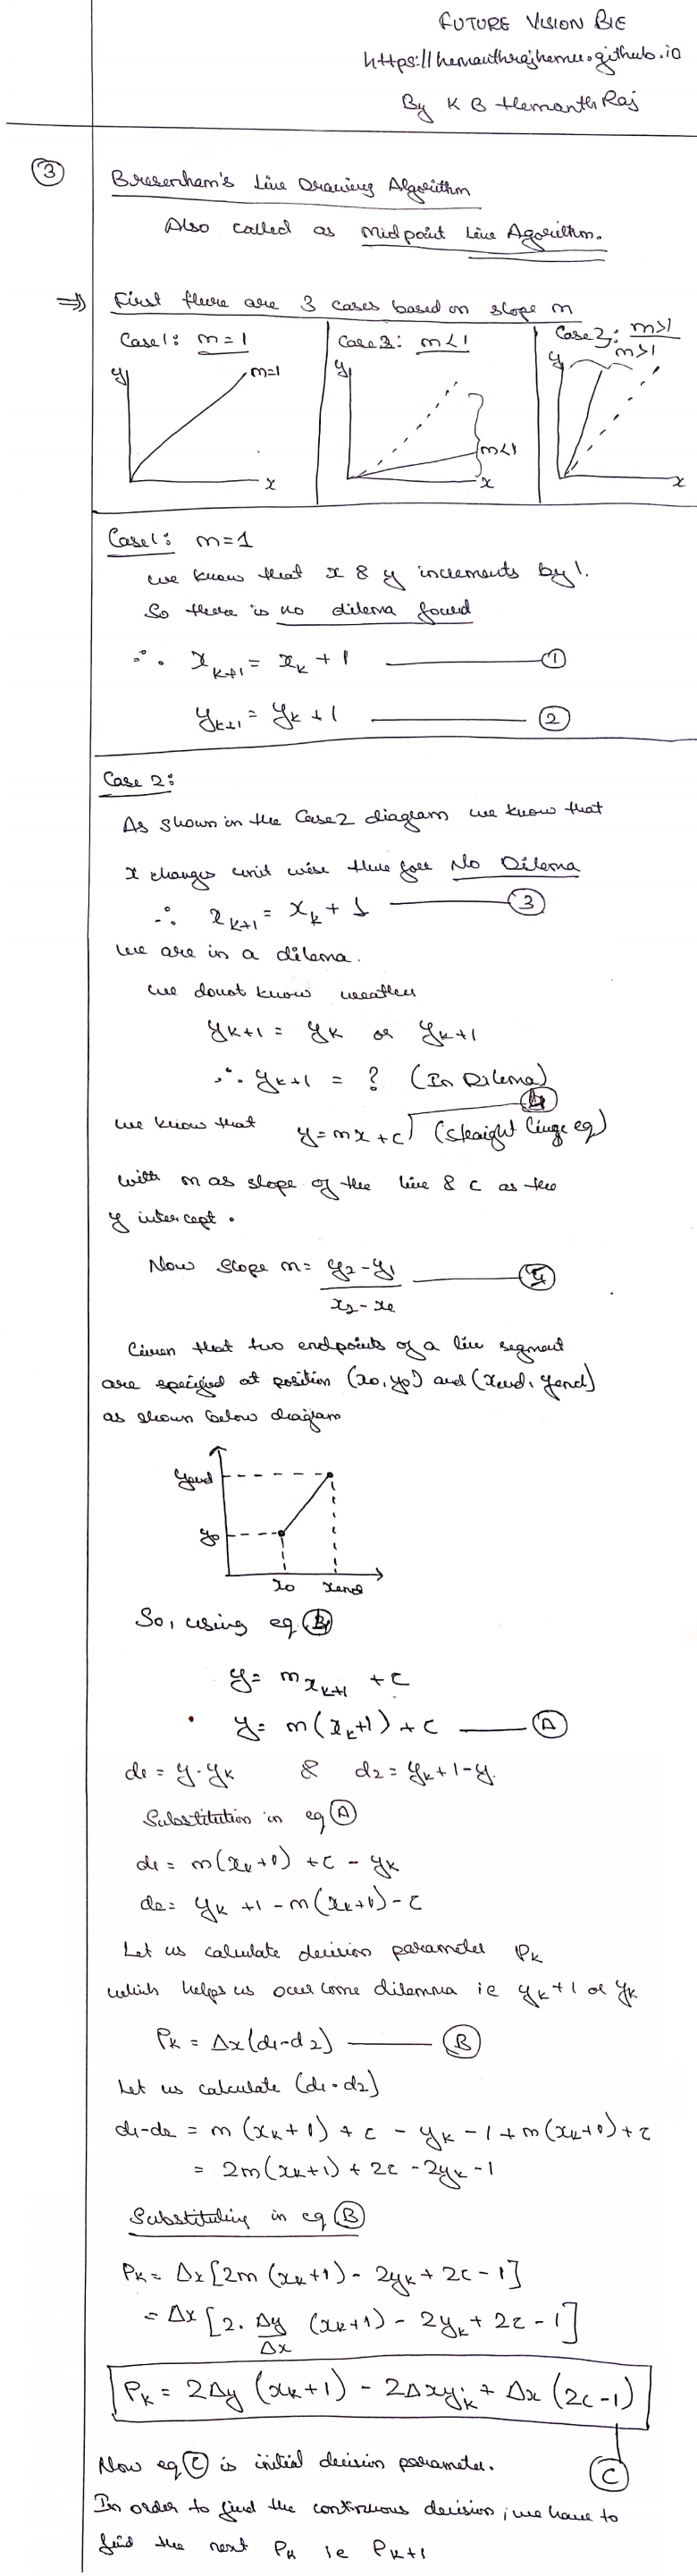
Bresenham's Line Draw Algorithm
is also called as Mid-Point Line Algorithm.
A straight line segment in a scene is defined by coordinate position for the end points of the segment
To display the line on a roaster monitor, the graphics system must first project the end points to integer screen coordinates and determine the nearest pixel positions along the line path between the two endpoints then the line color is loaded into the frame buffer at the corresponding pixel coordinates.
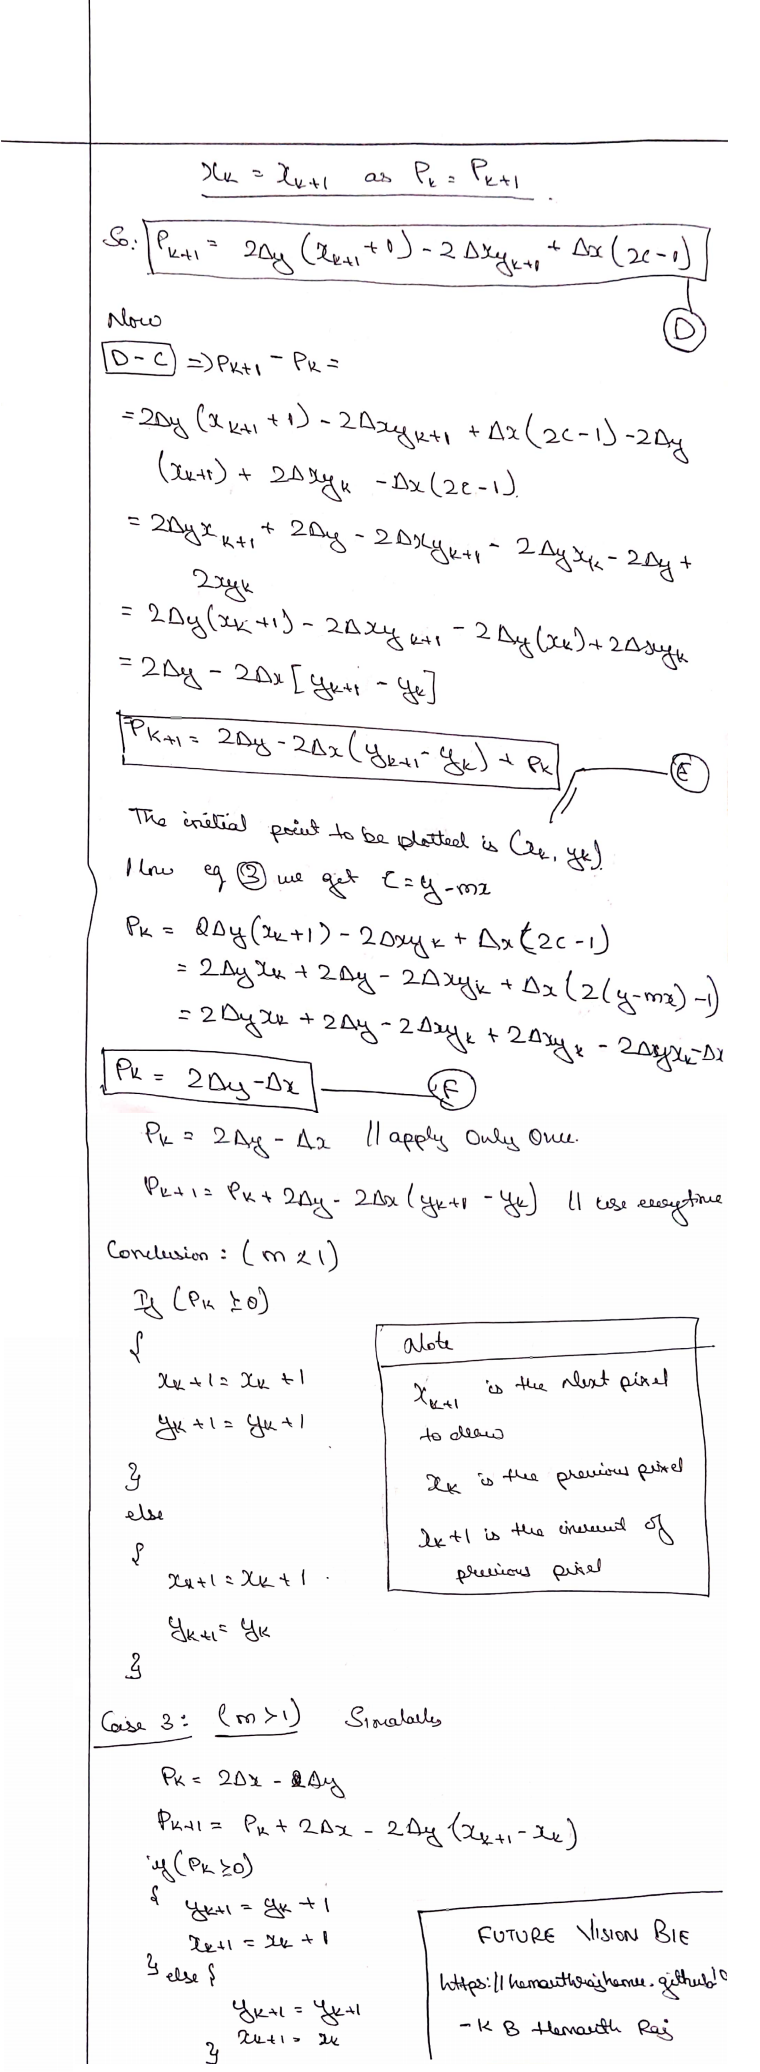
3.1 Algorithm
3.2 Step Wise Explanation:
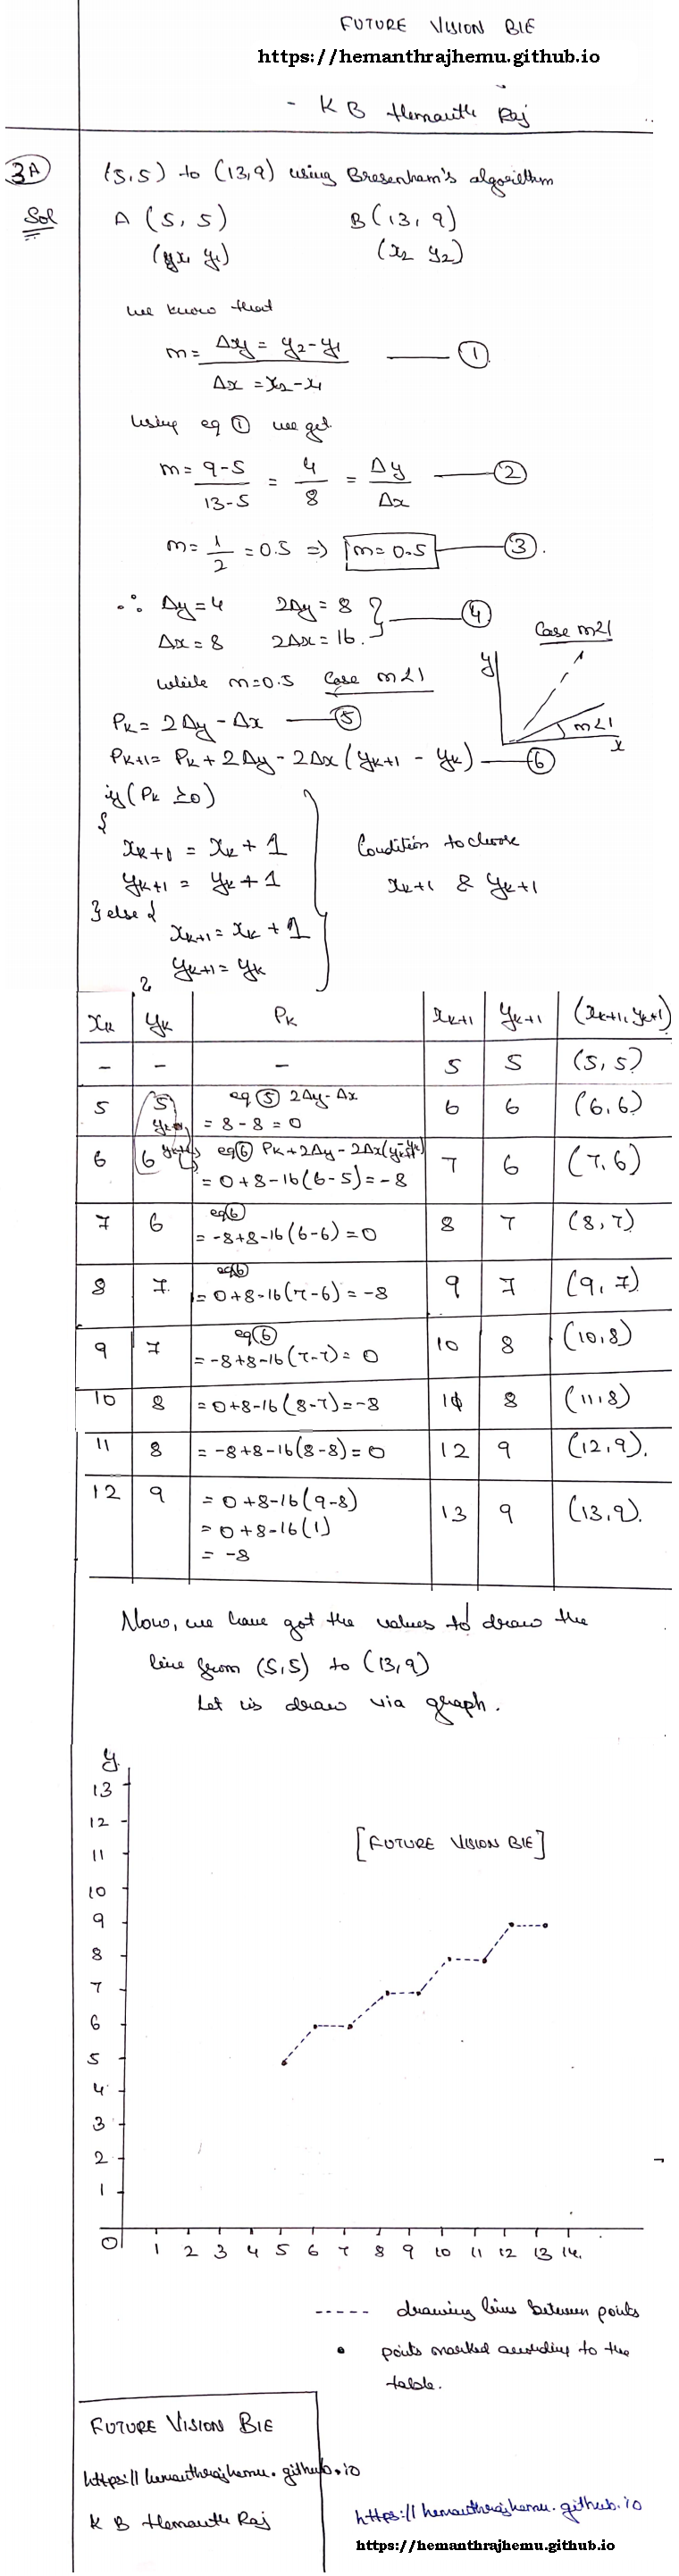
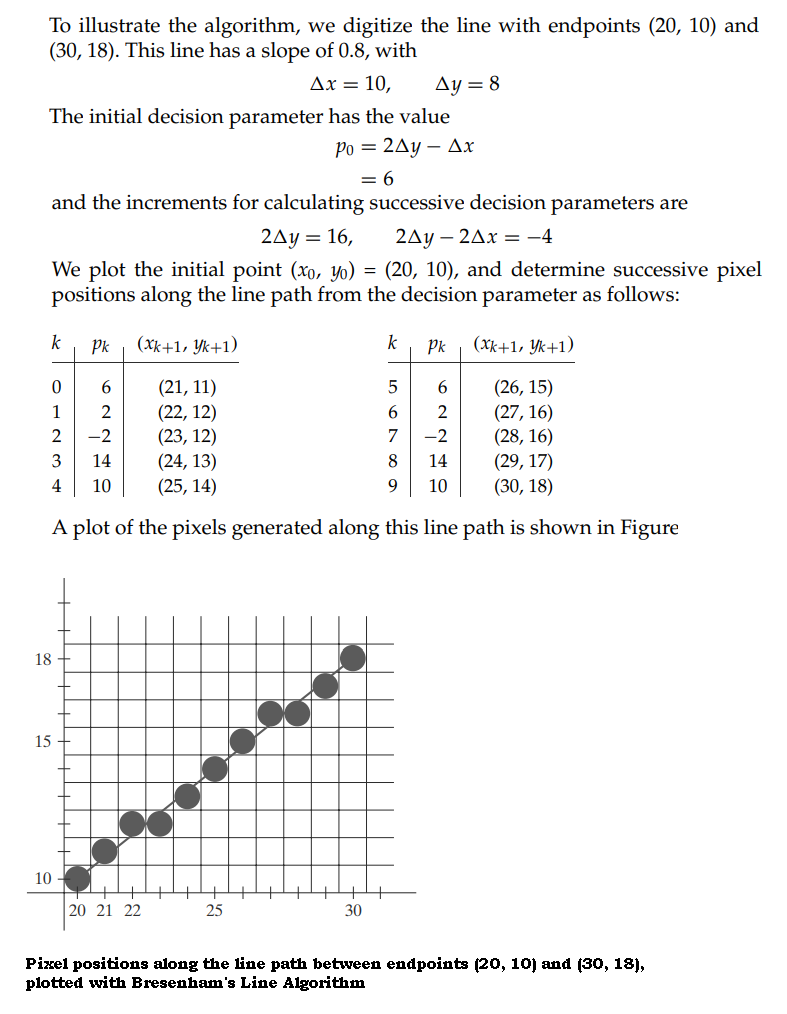
3.3 More Examples
In general, several different Cartesian reference frames
are used in the process of constructing and displaying a scene.
First, we can define the shapes of individual objects, such as trees or
furniture, within a separate reference frame for each object. These
reference frames are called modelling coordinates
, or
sometimes local coordinates
or master coordinates
.
Once the individual object shapes have been specified, we can construct
("model") a scene by placing the objects into appropriate locations within
a scene reference frame called world coordinates
.
This step involves the transformation of the individual modeling-coordinate frames to specified positions and orientations within the world-coordinate frame.
As an example, we could construct a bicycle by defining each of its parts
(wheels, frame, seat, handlebars, gears, chain, pedals) in a separate modeling coordinate frame
. Then, the component parts are
fitted together in world coordinates. If both bicycle wheels are the same
size, we need to describe only one wheel in a local-coordinate frame. Then
the wheel description is fitted into the world-coordinate bicycle
description in two places.
After all parts of a scene have been specified, the overall
world-coordinate description is processed through various routines onto one
or more output-device reference frames for display. This process is called
the viewing pipeline
.
World coordinate
positions are first converted to viewing coordinates
corresponding to the view we want of a scene, based on the position and
orientation of a hypothetical camera. Then object locations are transformed
to a two-dimensional (2D) projection of the scene, which corresponds to
what we will see on the output device. The scene is then stored in normalized coordinates
, where each coordinate value is in
the range from −1 to 1 or in the range from 0 to 1, depending on the
system.
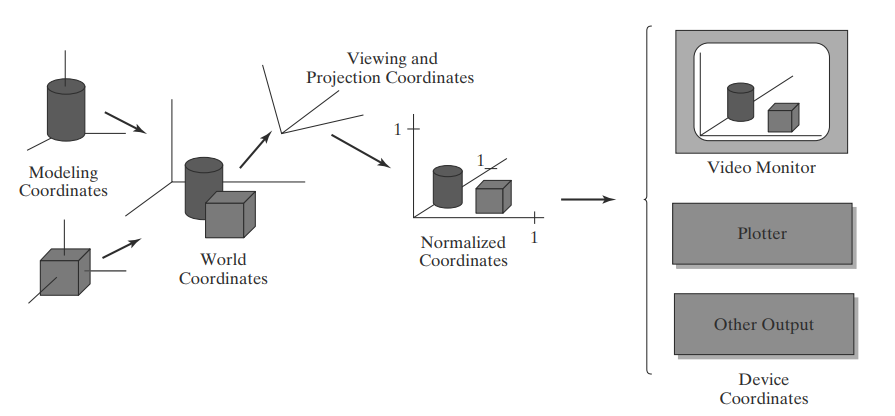
Fig 4.1 The transformation sequence from modeling coordinates to device coordinates for a three-dimensional scene. Object shapes can be individually defined in modeling-coordinate reference systems. Then the shapes are positioned within the world-coordinate scene. Next, world-coordinate specifications are transformed through the viewing pipeline to viewing and projection coordinates and then to normalized coordinates. At the final step, individual device drivers transfer the normalized-coordinate representation of the scene to the output devices for display
Normalized coordinates
are also referred to as normalized device coordinates
,
since using this representation makes a graphics package independent of the
coordinate range for any specific output device. We also need to identify
visible surfaces and eliminate picture parts outside the bounds for the
view we want to show on the display device.
Finally, the picture is scan-converted into the refresh buffer of a raster
system for display. The coordinate systems for display devices are
generally called device coordinates
, or screen coordinates
in the case of a video monitor.
Often, both normalized coordinates and screen coordinates are specified in a left handed coordinate reference frame so that increasing positive distances from the xy plane (the screen, or viewing plane) can be interpreted as being farther from the viewing position.
Figure 4.1 briefly illustrates the sequence of coordinate transformations from modeling coordinates to device coordinates for a display that is to contain a view of two three-dimensional (3D) objects. An initial modeling-coordinate position (xmc , ymc , z mc ) in this illustration is transferred to world coordinates, then to viewing and projection coordinates, then to left-handed normalized coordinates, and finally to a device-coordinate position (xdc , ydc ) with the sequence:
(xmc , ymc , zmc ) → (xwc , ywc , zwc ) → (xvc , y vc , zvc ) → (xpc , ypc , zpc )
→ (xnc , ync , znc ) → (x dc , ydc )
Device coordinates (xdc , ydc ) are integers within the range (0, 0) to (xmax, ymax) for a particular output device. In addition to the two-dimensional positions (xdc , ydc ) on the viewing surface, depth information for each device-coordinate position is stored for use in various visibility and surface-processing algorithms.
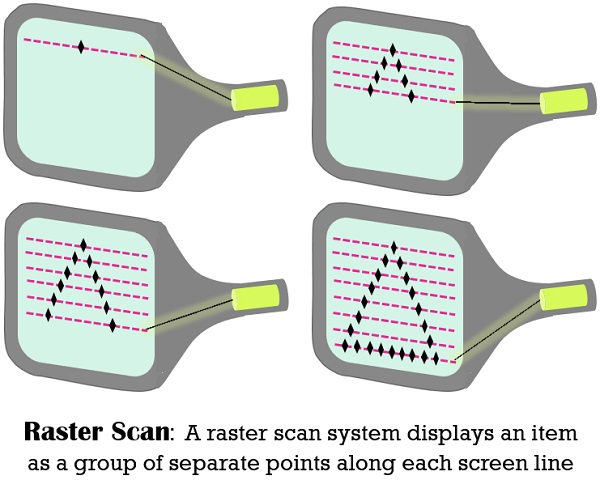
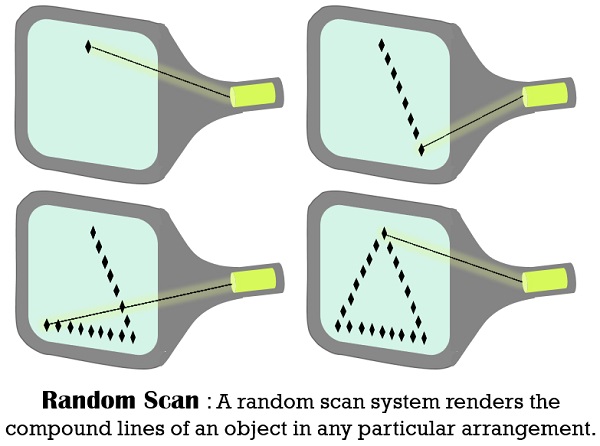
5.1 Difference Between Raster Scan Display & Random Scan display:
|
|
|
|
|
|
Swept across the screen and handles one row at a time and in downward direction. |
Directed to the portions of the screen where a picture is to be rendered. |
|
|
Poor, since it generates meander lines which are organized as distinct point sets. |
Good, as this produces even lines drawing. |
|
|
Stored as the combination of intensity values for all screen points. |
Stored as a group of line drawing instructions in a display file. |
|
|
Effectively displays realistic scenes. |
Unable to display realistic shaded scenes. |
|
|
Using pixels |
With the help of mathematical functions |
5.2 Application:
Refer 1st
Question & Answer or Click Here
Below Page NAVIGATION Links are Provided...
All the Questions on Question Bank Is SOLVED